What is data?
Data is nothing but information. However, it is usually imagined as a collection of values (either discrete or continuous) describing certain phenomena. A single value of the data is called datum.
Usually data is organized into structures such as lists, tables, dictionaries, and others. This organization makes simpler the task of providing additional context, or extract patterns from it.
Example: The teacher's logbook
In a classroom, the teacher has a logbook that contains information about their students.
Firstly, it has the name of the students… customarily presented in the form of a list:
| Name |
|---|
| Alice |
| Bob |
| Charley |
Data as the student's names is discrete, and can be arranged into a column (or row) array. This column (or row) array is referred as a \(1\)-dimensional array of data. Note that in addition, each datum is a word, also known as string in computer science.
Further, the logbook stores the student's grades:
| Name | Test 1 | Test 2 |
|---|---|---|
| Alice | 100 | 90 |
| Bob | 80 | 95 |
| Charley | 90 | 40 |
Now, our information is presented (or represented) as a table, expanding over \(2\) dimensions. It is said that our data is represented in a \(2\)-dimensional array. Interestingly, data extending over a column is of the same type, either a word or a numerical value.
Although the data in our two-dimensional array can be stored on a one-dimensional array, the latter representation does not ease the process of extracting information, since such list would mix
stringandintegervalues in the column (or row).
The representation of the grading data in the form of table serves to manipulate the information. For example, we could calculate the average grade of the course test-wise.
| Name | Test 1 | Test 2 |
|---|---|---|
| Alice | 100 | 90 |
| Bob | 80 | 95 |
| Charley | 90 | 40 |
| Average | 90 | 75 |
Some pieces of software, like Libreoffice Calc or Excel, allows us to manipulate two-dimensional data straightforwardly. We can extract statistical information, generate plots, create new variable based in the previous ones (also known as transforming the data). However, manipulating large amount of data using these software becomes cumbersome. In the future, we shall manipulate data using tools from the python ecosystem.
Let discuss another example.
Modeling the free falling body
In the above example considered discrete values, but if we'd like to model the movement of a body, by providing the information of its position as any given time, the necessary information is no longer discrete… it is continuous!
Note that from a practical perspective it is not possible to measure continuous variables, such as time or position, since every measurement instrument possess a limiting precision.
The position of a free falling body is modeled by the formula (without initial velocity)
\begin{equation} y(t) = y_0 - 5 t^{2} \end{equation}Since the time is a continuous variable, the position would be a continuous variable as well. The best way to represent our model data is to show a plot:
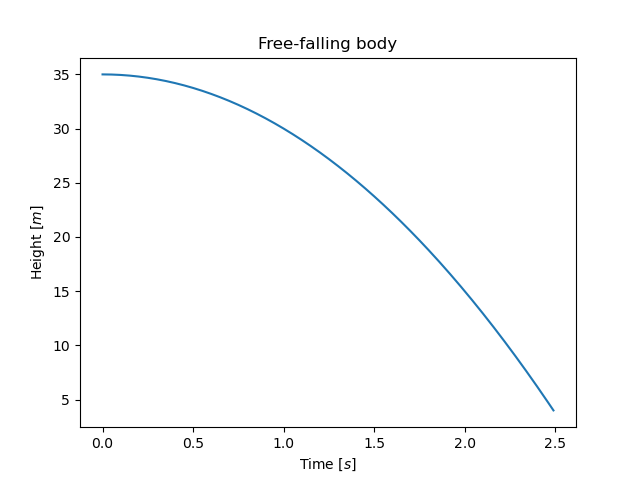
If we would like to manipulate this data using Libreoffice Calc or Excel, the continuous data has to be discretized, i.e. we take a set of discrete values of time, with its corresponding values of height:
| Time | Height |
|---|---|
| 0 | 35 |
| 0.25 | 34.6875 |
| 0.5 | 33.75 |
| 0.75 | 32.1875 |
| 1 | 30 |
| 1.25 | 27.1875 |
| 1.5 | 23.75 |
| 1.75 | 19.6875 |
| 2 | 15 |
| 2.25 | 9.6875 |
| 2.5 | 3.75 |
Final Thoughts
Data is a collection of information, which can be represented as a table (in the discrete values case) or functions (in the continuous case), that allows us to extract information about phenomena.