Portfolio
Oscar Castillo-Felisola
Welcome!
In this page you will find information about projects that I've executed.
Agricultural Land Classifier
This projects presents a journey in to the subject of Deep Learning for image classification. Our purpose is to automatically classify satellite images, determining whether the land is apt for agricultural development. This will help saving time and effort compared to manual classification.
Intended GOAL: helping an agricultural company build its development strategy efficiently.
The project is developed in four stages:
- Data preparation and exploration: notebooks 1 to 3.
- Building and comparing basic classifiers: notebooks 4 to 6.
- Advanced models with Vision Transformers (ViT): notebooks 7 and 8.
- Integration and Evaluation: notebook 9.
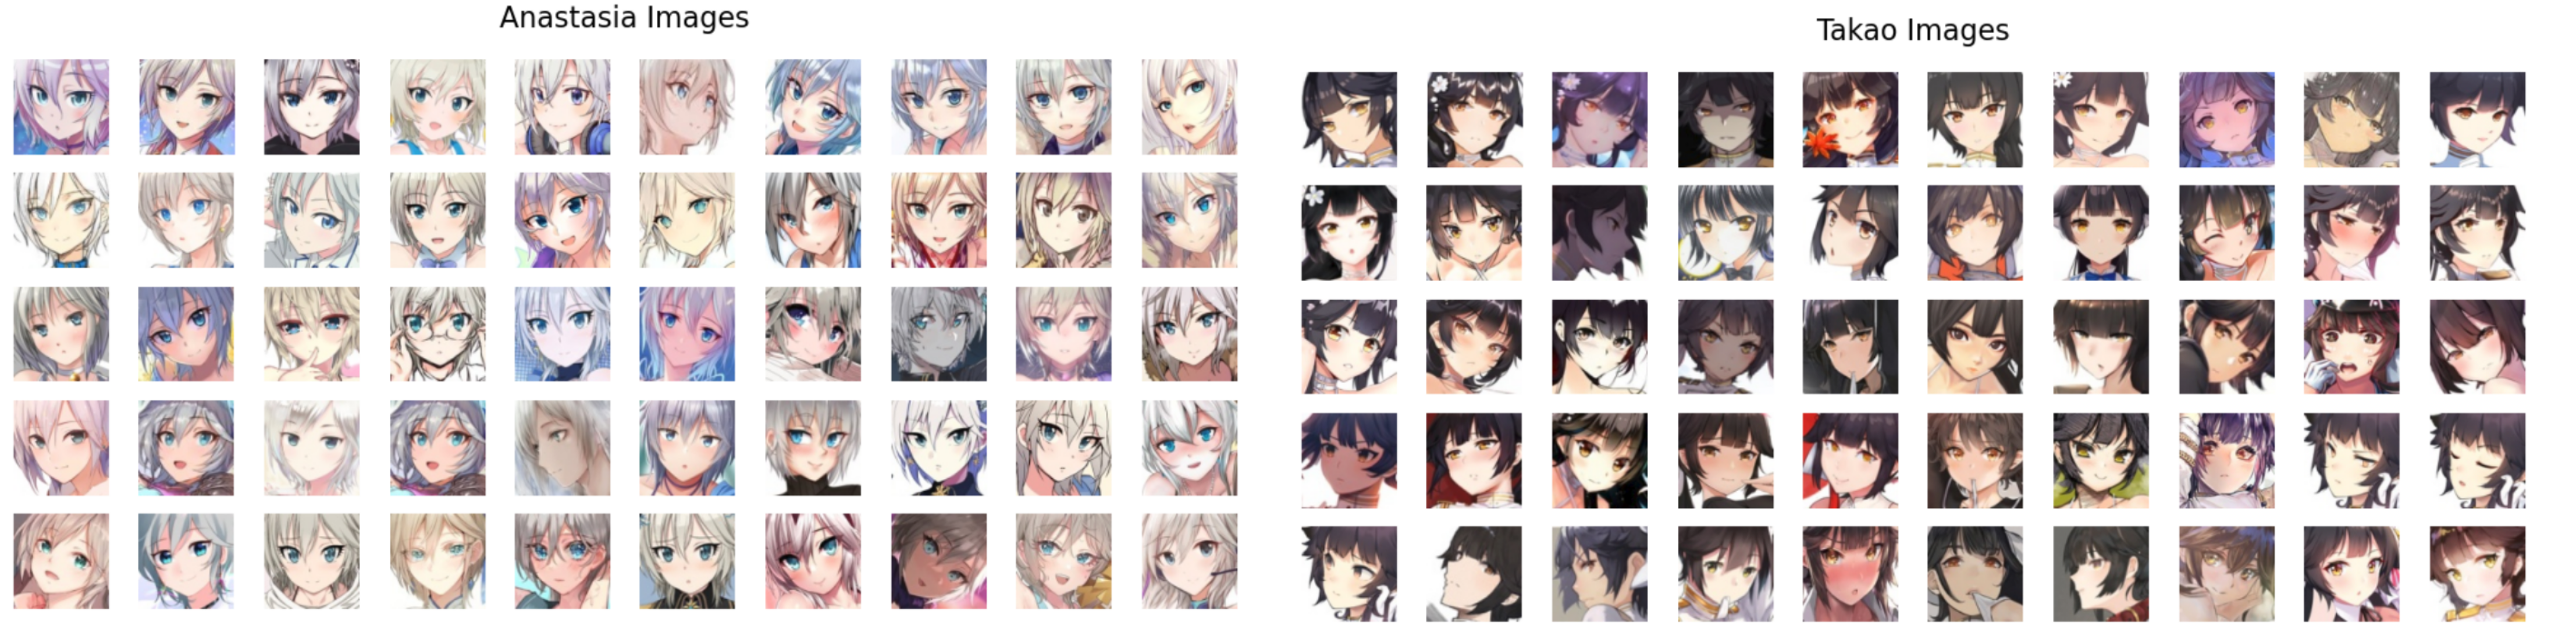
Convolutional Neural Network for Anime Image Classification
In this project we use PyTorch build a convolutional neural network (CNN) for image classification. Our aim is to be able of classify the images into the correct categories.
The data comes from the paper AniWho: A Quick and Accurate Way to Classify Anime Character Faces in Images. The dataset consists of 9,738 images across 130 character classes, with approximately 75 images per class, sourced from the Danbooru website—a platform developed by the Japanese animation-style cartoon community.
League of Legends Match Predictor

League of Legends is popular multiplayer online battle arena (MOBA) game. It generates a large amount of data regarding the performance of each player in battles.
The aim of this project is to analyze the data generated by the game, utilizing a Neural Network (also abbreviated as NN) with torch, through its python interface, pytorch. The model used for our prediction is a Logistic Regression.
The project is developed in eight steps:
- Data Loading and Pre-processing
- Implementing a logistic regression model using PyTorch
- Training the logistic regression model on the dataset
- Implementing optimization techniques and evaluating the model's performance
- Visualizing and Interpreting
- Saving and loading the trained model
- Performing hyper-parameter tuning to find the best learning rate
- Evaluating feature importance to understand the impact of each feature on the prediction
Classify Waste Products Using Transfer Learning and Fine-Tuning
The aim of the project is to develop an automated waste classification model that can accurately differentiate between recyclable and organic waste based on images. By the end of this project, you will have trained, fine-tuned, and evaluated a model using transfer learning, which can then be applied to real-world waste management processes.
GOAL: A trained model that classifies waste images into recyclable and organic categories.
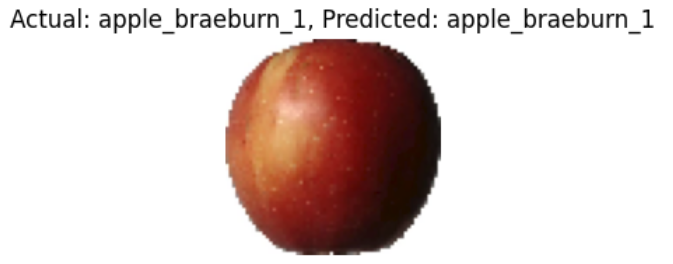
Fruit Classification Using Transfer Learning
In this project we classify images of fruits using transfer learning with the pre-trained VGG16 model. Transfer learning enables leveraging a model trained on a large dataset (like ImageNet) and applying it to your dataset with fewer data and computational resources.
- Aim
- The aim is to build a fruit image classifier using transfer learning. You will fine-tune a pre-trained model on a custom dataset of fruit images to enable it to classify fruits effectively.
- Final Output
- a trained deep learning model capable of classifying various fruit images into their respective categories. You will also visualize the model's accuracy and predictions on sample test images.
Aircraft damage using pretrained models
The detection of aircraft damage is extremely important for the safety and longevity of aircraft. Historically, the inspection process has been made manually, and it is very time consuming and prone to human error. However, nowadays it is possible to use computer vision to automate the inspection.
The aim of this project is to develop an automated model that classifies aircraft damage from images. The damage would be classified into two categories: "dent" and "crack". For this end we use a pretrained VGG16 model (see VGG-16 | CNN model) to analyze the images and a transformer to generate captions and summaries of the images.
Building our own data visualization agent
In this project we integrate LangChain and a Large Language Model (LLM) to be able of interacting with our data and retrieving the necessary information to understand the purchase behavior of an e-commerce's customers.
Objectives
- Use LangChain with large language models: Understand and apply the Langchain framework in conjunction with LLMs to interact with and analyze data stored in CSV files through natural language processing.
- Create conversational data agents: Build a conversational agent that can understand and respond to natural language queries about data, enabling users to ask questions directly and receive immediate answers.
- Implement data visualization through dialogue: Integrate data visualization tools within your conversational agent, allowing you to request and generate visual data representations such as graphs, charts, and heatmaps dynamically based on your queries.
- Enhance decision-making process: Develop the capability to derive actionable insights from data via interactive dialogues and visual outputs, thereby improving the decision-making process and making data analysis accessible to non-technical stakeholders.
Space X Falcon 9 First Stage Landing Prediction
This repository host an end-to-end project that is used to predict the success or failure of the first stage of Space X Falcon 9 rocket. The stages of the project are the following:
- Data Collection
- From existing datasets and web scraping.
- Data Wrangling
- Identification of missing values and their modification.
- Exploratory Analysis
- Using SQL and visualizations the data is explored, and prepared for Data Feature Engineering.
- Model Building
- The data is used to train and deploy two machine learning models (
LogisticRegressionandKNeighborsClissifier), and compare their performances.
The results of our analysis is presented in a PDF report, which might be presented to the stakeholders.
Rainfall prediction classifier
In this project we use data from the Australian Government's Bureau of Meteorology to build a models to predict the rainfall probability.
In this end-to-end project, data is loaded, cleaned, explored and transformed. Then, a pipeline is built in order to serialize various processes (including data pre-processing and post-processing), which optimize the analysis of the space of hyperparameters (Grid Cross-Validation, GridSearchCV).
We also compare two machine learning models, RandomForestClassifier and LogisticRegression, using several metrics.
Create visualizations using Matplotib Seaborn and Folium
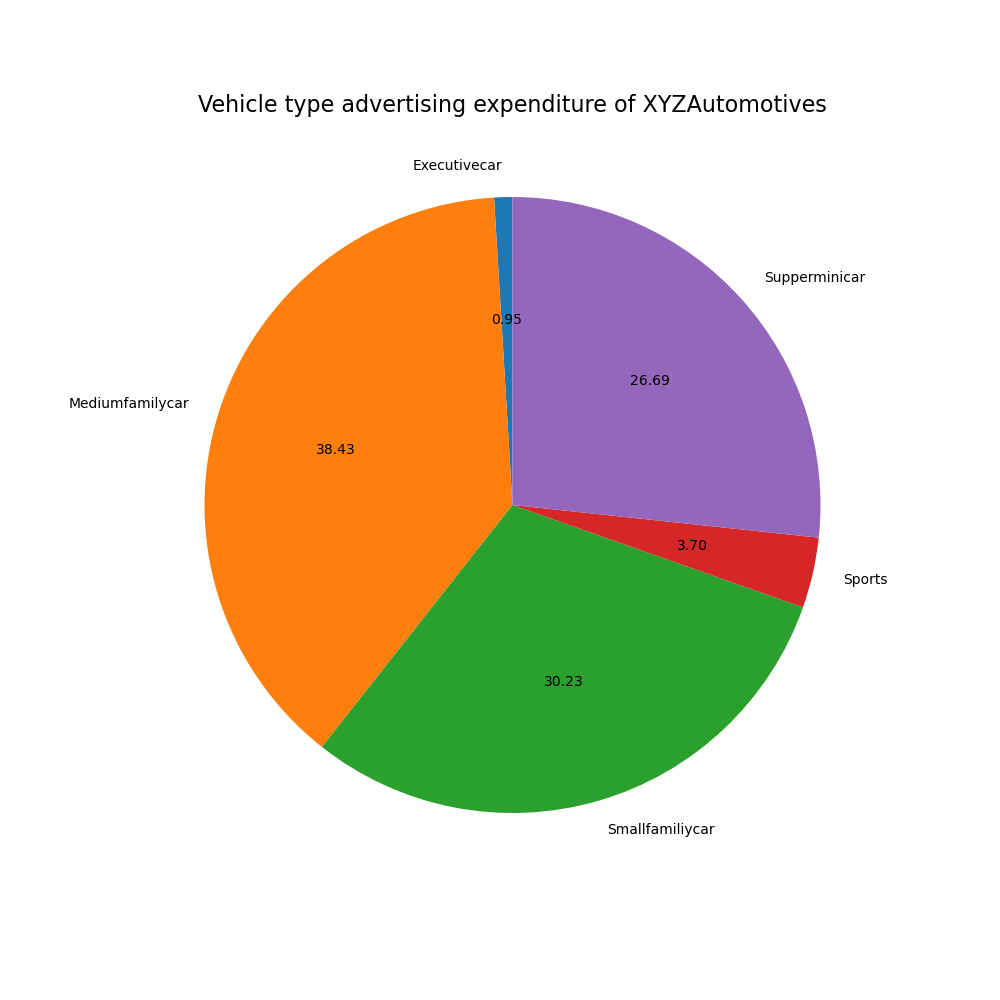
The aim of this project is to create plots that serve to answer questions related to the historical sales of cars, based on a dataset of cars sales in the USA. These are intended to identify periods of economic recession, sales of cars by type, power or fuel consumption. We also identify the regions of the country where the sales suffer the most when a crisis hits.
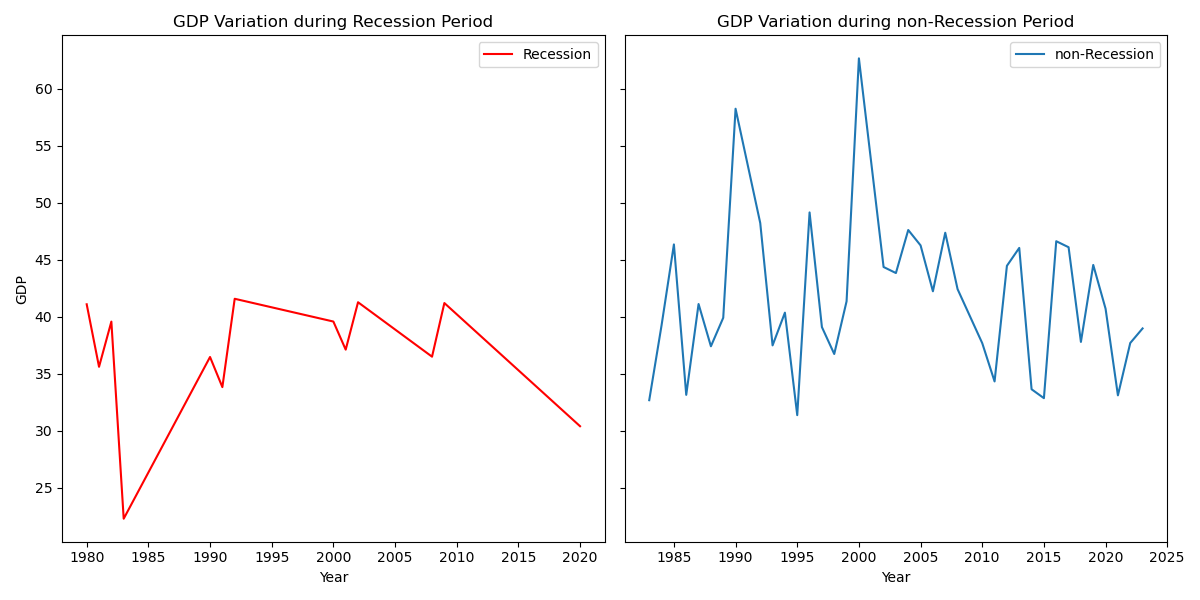
The whole project is formed by two files: a jupyter notebook, in which we use libraries like matplotlib, seaborn and folium to create our visualizations; and a python script which generate an interactive dashboard (similar to those generated by Power BI) through the library dash.
The interactive response of the dashboard is achieved through the use of @callback functions in our script.
House sales in King Count - USA
In this repository we present an end-to-end project that aims to predict the prices of real state properties in King Count, Washington - USA.
King County is a county located in the U.S. state of Washington. The population was 2,269,675 in the 2020 census, making it the most populous county in Washington, and the 12th-most populous in the United States. The county seat is Seattle, also the state's most populous city.
Structure of the repository
. root
|_ README
|_ notebooks
|  |_ review (5 notebooks)
|  |_ practice (6 notebooks)
|  |_ House_Sales_in_King_Count_USA.ipynb
Notebooks: review
In this folder there are five notebooks that review the concepts of data analysis, while we build a model to predict the prices of vehicles according to their features. The notebooks consider: importing dataset, data wrangling, exploratory analysis, model development, and model evaluation and refinement.
Notebooks: practice
In this folder there are six notebooks that aim to practice the concepts of data analysis, while we build a model to predict the prices of laptop according to their features. The notebooks consider: importing dataset, data wrangling, exploratory analysis, model development, model evaluation and refinement, and a short end-to-end project.
File: House sales in King Count
This file is the intended project. The notebook is an end-to-end project, that includes all the stages treated in separated files in the other notebooks.
SQL manipulations through Python
In this project we explore data available on Chicago's Data Portal. We download and manipulate three of the datasets:
- Socioeconomic indicators of Chicago
- Chicago public schools
- Chicago crime data.
In order to explore and manipulate the datasets, we use the extension ipython-sql, and the libraries sqlite3 and csv.
We build a database that contains three tables (one for each dataset), using the connect() method of the sqlite3 library, and use the magic command %%sql to execute various queries on the database.