Using folium to visualize the traveling salesman path
![]()
The purpose of this article is to use folium to visualize in a map, the itinerary of the salesman that I obtained in a previous article.
Folium builds on the data wrangling strengths of the Python ecosystem and the mapping strengths of the
Leaflet.jslibrary. Manipulate your data in Python, then visualize it in a Leaflet map via Folium.
I heard about folium while I was going through one of my certifications. I was amazed by the capabilities of the library. If you check the pypi package page you'll find that it is a very recent project (released on 16th June, 2025… half a year ago!), still in its version 0.20.0; but it is very usable and somehow mature package.
We started with a dictionary containing the names of the cities as keys and the geographic location as values:
city_coords = {
    "São Paulo":       (-23.5505, -46.6333),
    "Rio de Janeiro":  (-22.9068, -43.1729),
    "Brasília":        (-15.8267, -47.9218),
    "Salvador":        (-12.9777, -38.5016),
    "Fortaleza":       (-3.7319,  -38.5267),
    "Belo Horizonte":  (-19.9167, -43.9345),
    "Manaus":          (-3.1190,  -60.0217),
    "Curitiba":        (-25.4284, -49.2733),
    "Recife":          (-8.0476,  -34.8770),
    "Porto Alegre":    (-30.0346, -51.2177),
    "Goiânia":         (-16.6786, -49.2550),
    "Belém":           (-1.4558,  -48.5044),
    "Guarulhos":       (-23.4548, -46.5333),
    "Campinas":        (-22.9056, -47.0608),
    "São Luís":        (-2.5307,  -44.3068),
    "São Gonçalo":     (-22.8222, -42.9625),
    "Maceió":          (-9.6658,  -35.7350),
    "Duque de Caxias": (-22.7856, -43.3115),
    "Nova Iguaçu":     (-22.7595, -43.4528),
    "Natal":           (-5.7950,  -35.2094)
}
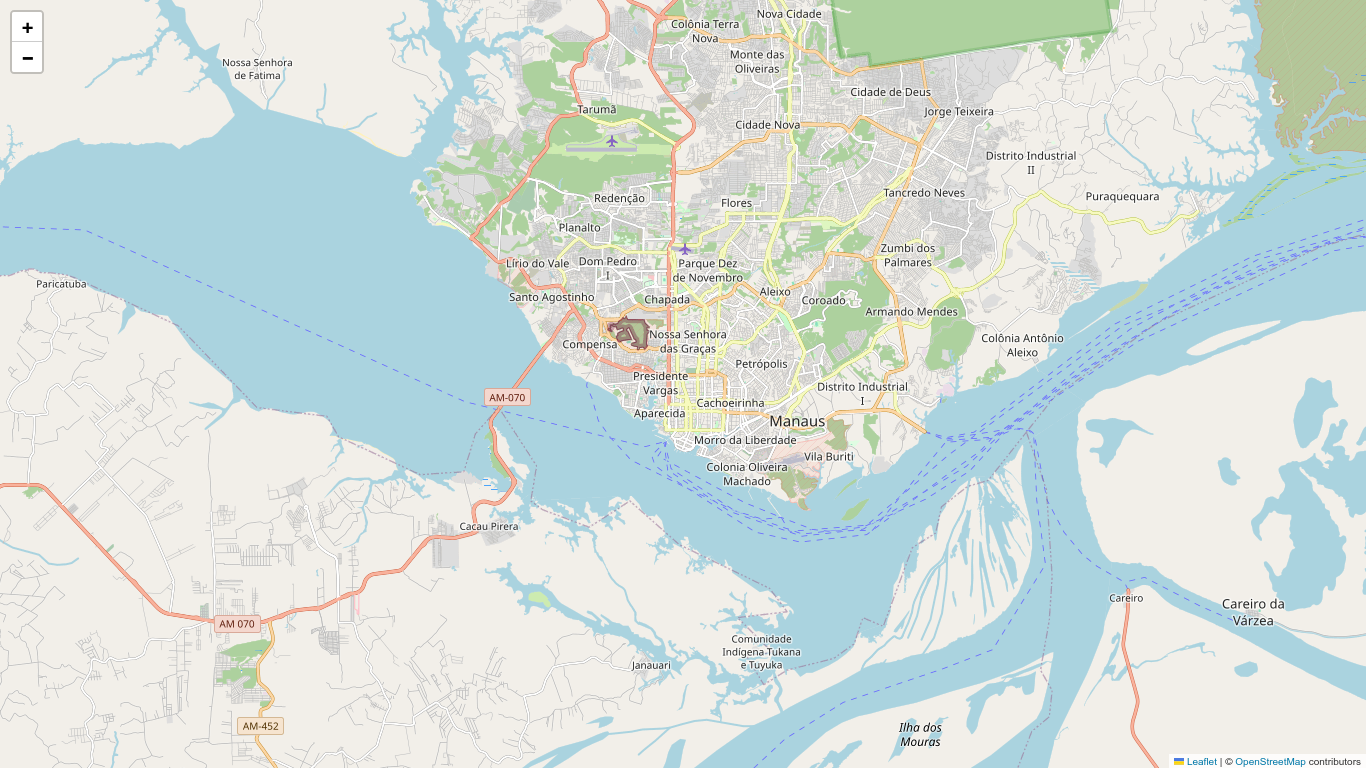
We can now use folium to visualize one of this cities in a map
from PIL import Image

m = folium.Map(
    location=city_coords["Manaus"],
    zoom_start=12
    )
The map cannot be saved directly as a PNG file, but we can build a function to help us with this task (I'll use the solution posted here to save a PNG version of the map)
import io
from PIL import Image

def save_map(map, filename):
    img_data = map._to_png(5)
    img = Image.open(io.BytesIO(img_data))
    img.save(filename)
    print(f"Map saved as PNG with name: {filename}")
save_map(m, "../images/folium-manaus.png")
Map saved as PNG with name: ../images/folium-manaus.png
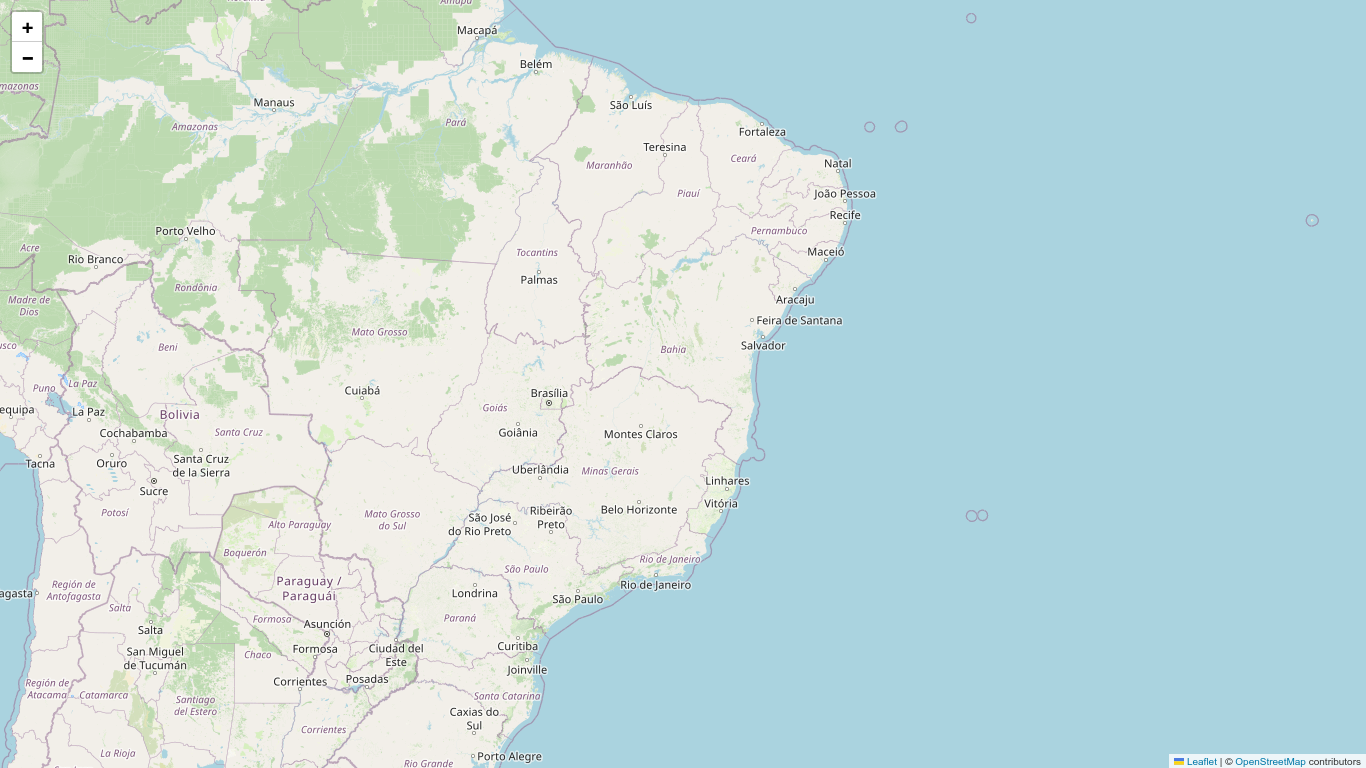
Returning to our problem. By inspection, we note that the middle value of the city coordinates are approximately [-15,-42]. So, let's relocate the map to visualize the whole set of cities.
m = folium.Map(location=[-15,-42], zoom_start=5)
m
save_map(m, "folium-brazil.png")
Let me recycle some of the code from the traveling salesman problem article, but I'll modify the function defining_path to return both the itinerary and visited_cities
from geopy.distance import geodesic
from itertools import combinations
from random import sample, choice
import numpy as np

distances = list()
cities = list(city_coords.keys())

for city_a, city_b in combinations(cities, 2):
    coord_a, coord_b = city_coords[city_a], city_coords[city_b]
    km = int(round(geodesic(coord_a, coord_b).kilometers))
    distances.append((city_a, city_b, km))

dt = np.dtype([("city_start", "U15"), ("city_end", "U15"), ("distance", int)])
data_set = np.array(distances, dtype=dt)

def random_start_city(cities):
    """Returns the random city to start the travel"""
    return choice(cities)

def closest_city(routes, ind=0):
    """Sort the list by distance and return shortest distance route"""
    route = sorted(routes, key=lambda dist: dist[2], reverse=True).pop(-1-ind)
    return route

def defining_path(city=None):
    itinerary = list()
    starting_city = random_start_city(cities) if city==None else city
    print("Starting City:", starting_city)
    visited_cities = [starting_city]
    for i in range(len(cities)-1):
        ind = 0
        search = True
        while search:
            path = closest_city(data_set[[starting_city in data for data in data_set]], ind)
            city_a = path[0] if starting_city == path[0] else path[1]
            city_b = path[0] if starting_city != path[0] else path[1]
            if city_b in visited_cities:
                ind += 1
                continue
            else:
                itinerary.append(path)
                visited_cities.append(city_b)
                starting_city = city_b
                search = not search
    return itinerary, visited_cities
Let's try it!
paths = defining_path()
for num, path in enumerate(paths):
    print(num+1, path)
Starting City: Manaus
1 ('Manaus', 'Belém', 1294)
2 ('Belém', 'São Luís', 482)
3 ('Fortaleza', 'São Luís', 656)
4 ('Fortaleza', 'Natal', 433)
5 ('Recife', 'Natal', 252)
6 ('Recife', 'Maceió', 202)
7 ('Salvador', 'Maceió', 475)
8 ('Salvador', 'Belo Horizonte', 962)
9 ('Belo Horizonte', 'Nova Iguaçu', 319)
10 ('Duque de Caxias', 'Nova Iguaçu', 15)
11 ('Rio de Janeiro', 'Duque de Caxias', 20)
12 ('Rio de Janeiro', 'São Gonçalo', 24)
13 ('Guarulhos', 'São Gonçalo', 372)
14 ('São Paulo', 'Guarulhos', 15)
15 ('São Paulo', 'Campinas', 84)
16 ('Curitiba', 'Campinas', 359)
17 ('Curitiba', 'Porto Alegre', 545)
18 ('Porto Alegre', 'Goiânia', 1493)
19 ('Brasília', 'Goiânia', 171)
While the list of visited cities is
for city in visited:
    print(city)
Manaus
Belém
São Luís
Fortaleza
Natal
Recife
Maceió
Salvador
Belo Horizonte
Nova Iguaçu
Duque de Caxias
Rio de Janeiro
São Gonçalo
Guarulhos
São Paulo
Campinas
Curitiba
Porto Alegre
Goiânia
Brasília
Next, we build a list contain the coordinates of the cities in our visited_cities list:
path_coord = [city_coords[city] for city in visited]
print(path_coord)
[(-3.119, -60.0217), (-1.4558, -48.5044), (-2.5307, -44.3068), (-3.7319, -38.5267), (-5.795, -35.2094), (-8.0476, -34.877), (-9.6658, -35.735), (-12.9777, -38.5016), (-19.9167, -43.9345), (-22.7595, -43.4528), (-22.7856, -43.3115), (-22.9068, -43.1729), (-22.8222, -42.9625), (-23.4548, -46.5333), (-23.5505, -46.6333), (-22.9056, -47.0608), (-25.4284, -49.2733), (-30.0346, -51.2177), (-16.6786, -49.255), (-15.8267, -47.9218)]
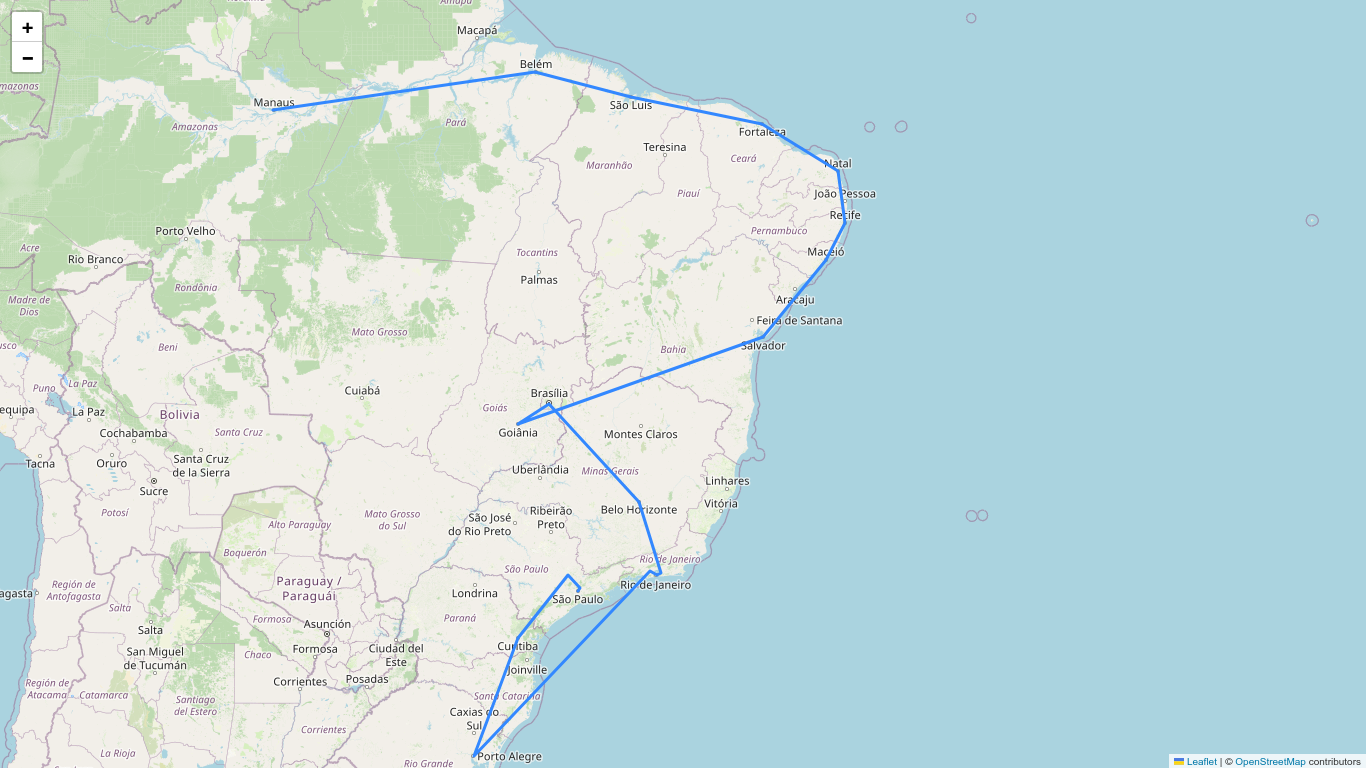
And use it to visualize the "path" the salesman should follow
m = folium.Map(location=[-15,-42], zoom_start=5)
folium.PolyLine(path_coord, tooltip="Coast").add_to(m)
m
save_map(m, "folium-itinerary.png")
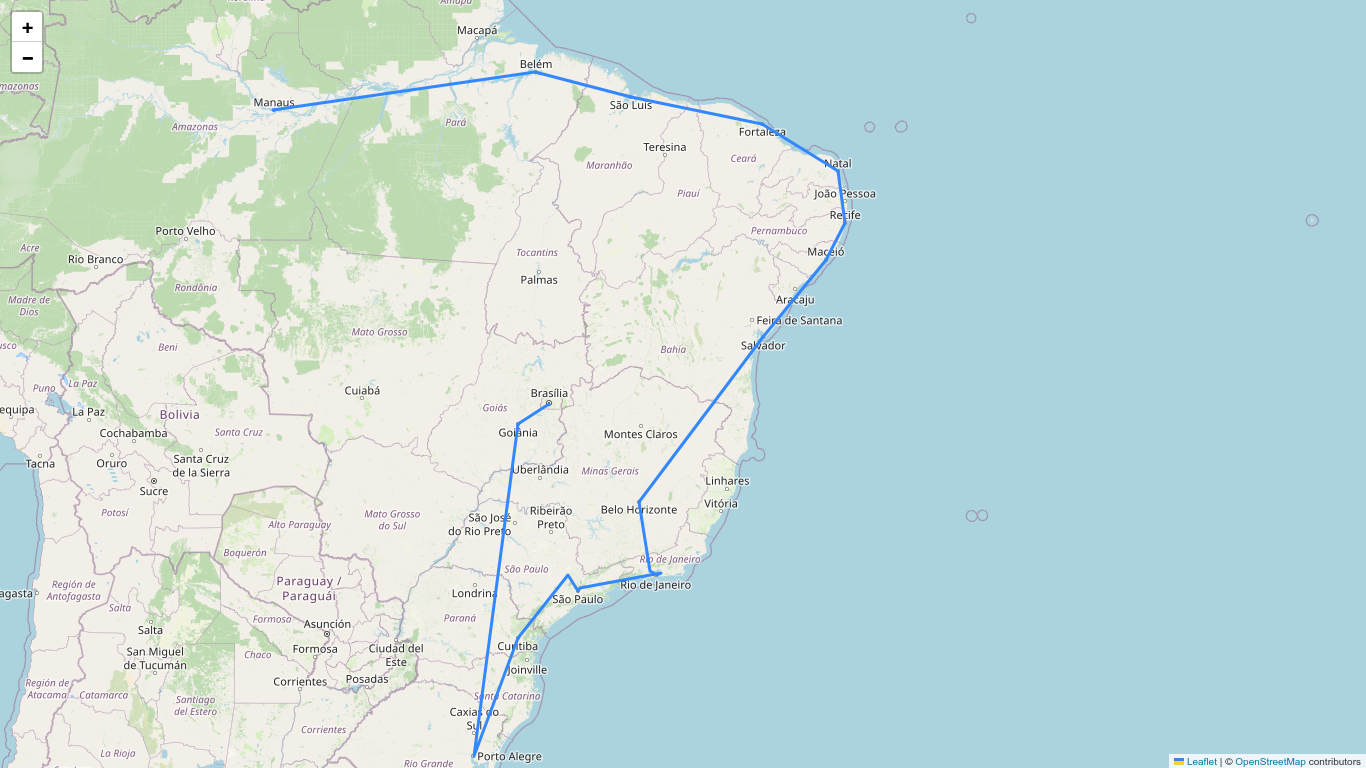
We could use our function definingpath to find the itinerary path starting from a given city, for example São Paulo:
m = folium.Map(location=[-15,-42], zoom_start=5)
paths, visited = defining_path("São Paulo")
path_coord = [city_coords[city] for city in visited]
folium.PolyLine(path_coord, tooltip="Coast").add_to(m)
m