Housing distribution in Chile: by region
Using the data from the 2024 census in Chile, I wanted to see the number of houses by region.
As mentioned before, I downloaded the data from the official census webpage, in the form of parquet datasets. I load the data a few columns into a pandas dataframe, grouped by region using the .groupby() method, and count the values of the column "comuna"
import pandas as pd

df = pd.read_parquet("./viv_hog_per_censo2024/viviendas_censo2024.parquet",
                     columns=["region", "comuna"])
df_reg = df.groupby("region")["comuna"].count()

ax = df_reg.plot(kind="bar")
ax.set_xlabel("Region")
ax.set_ylabel("Num. of houses")
ax.set_title("Housing distribution by Region", fontsize=20)
fig = ax.get_figure()
fig.savefig(filename)
return filename
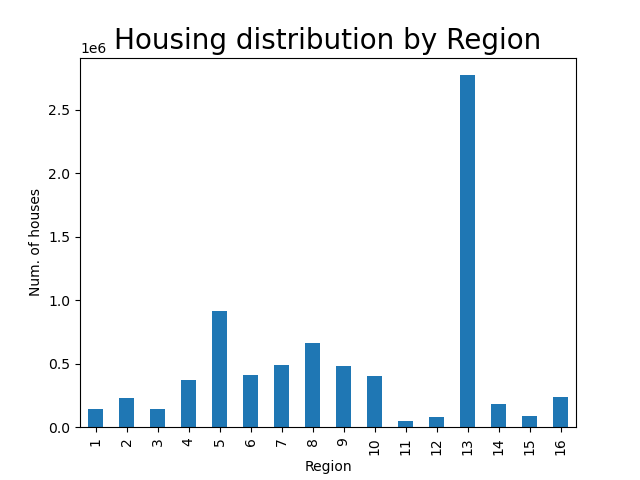
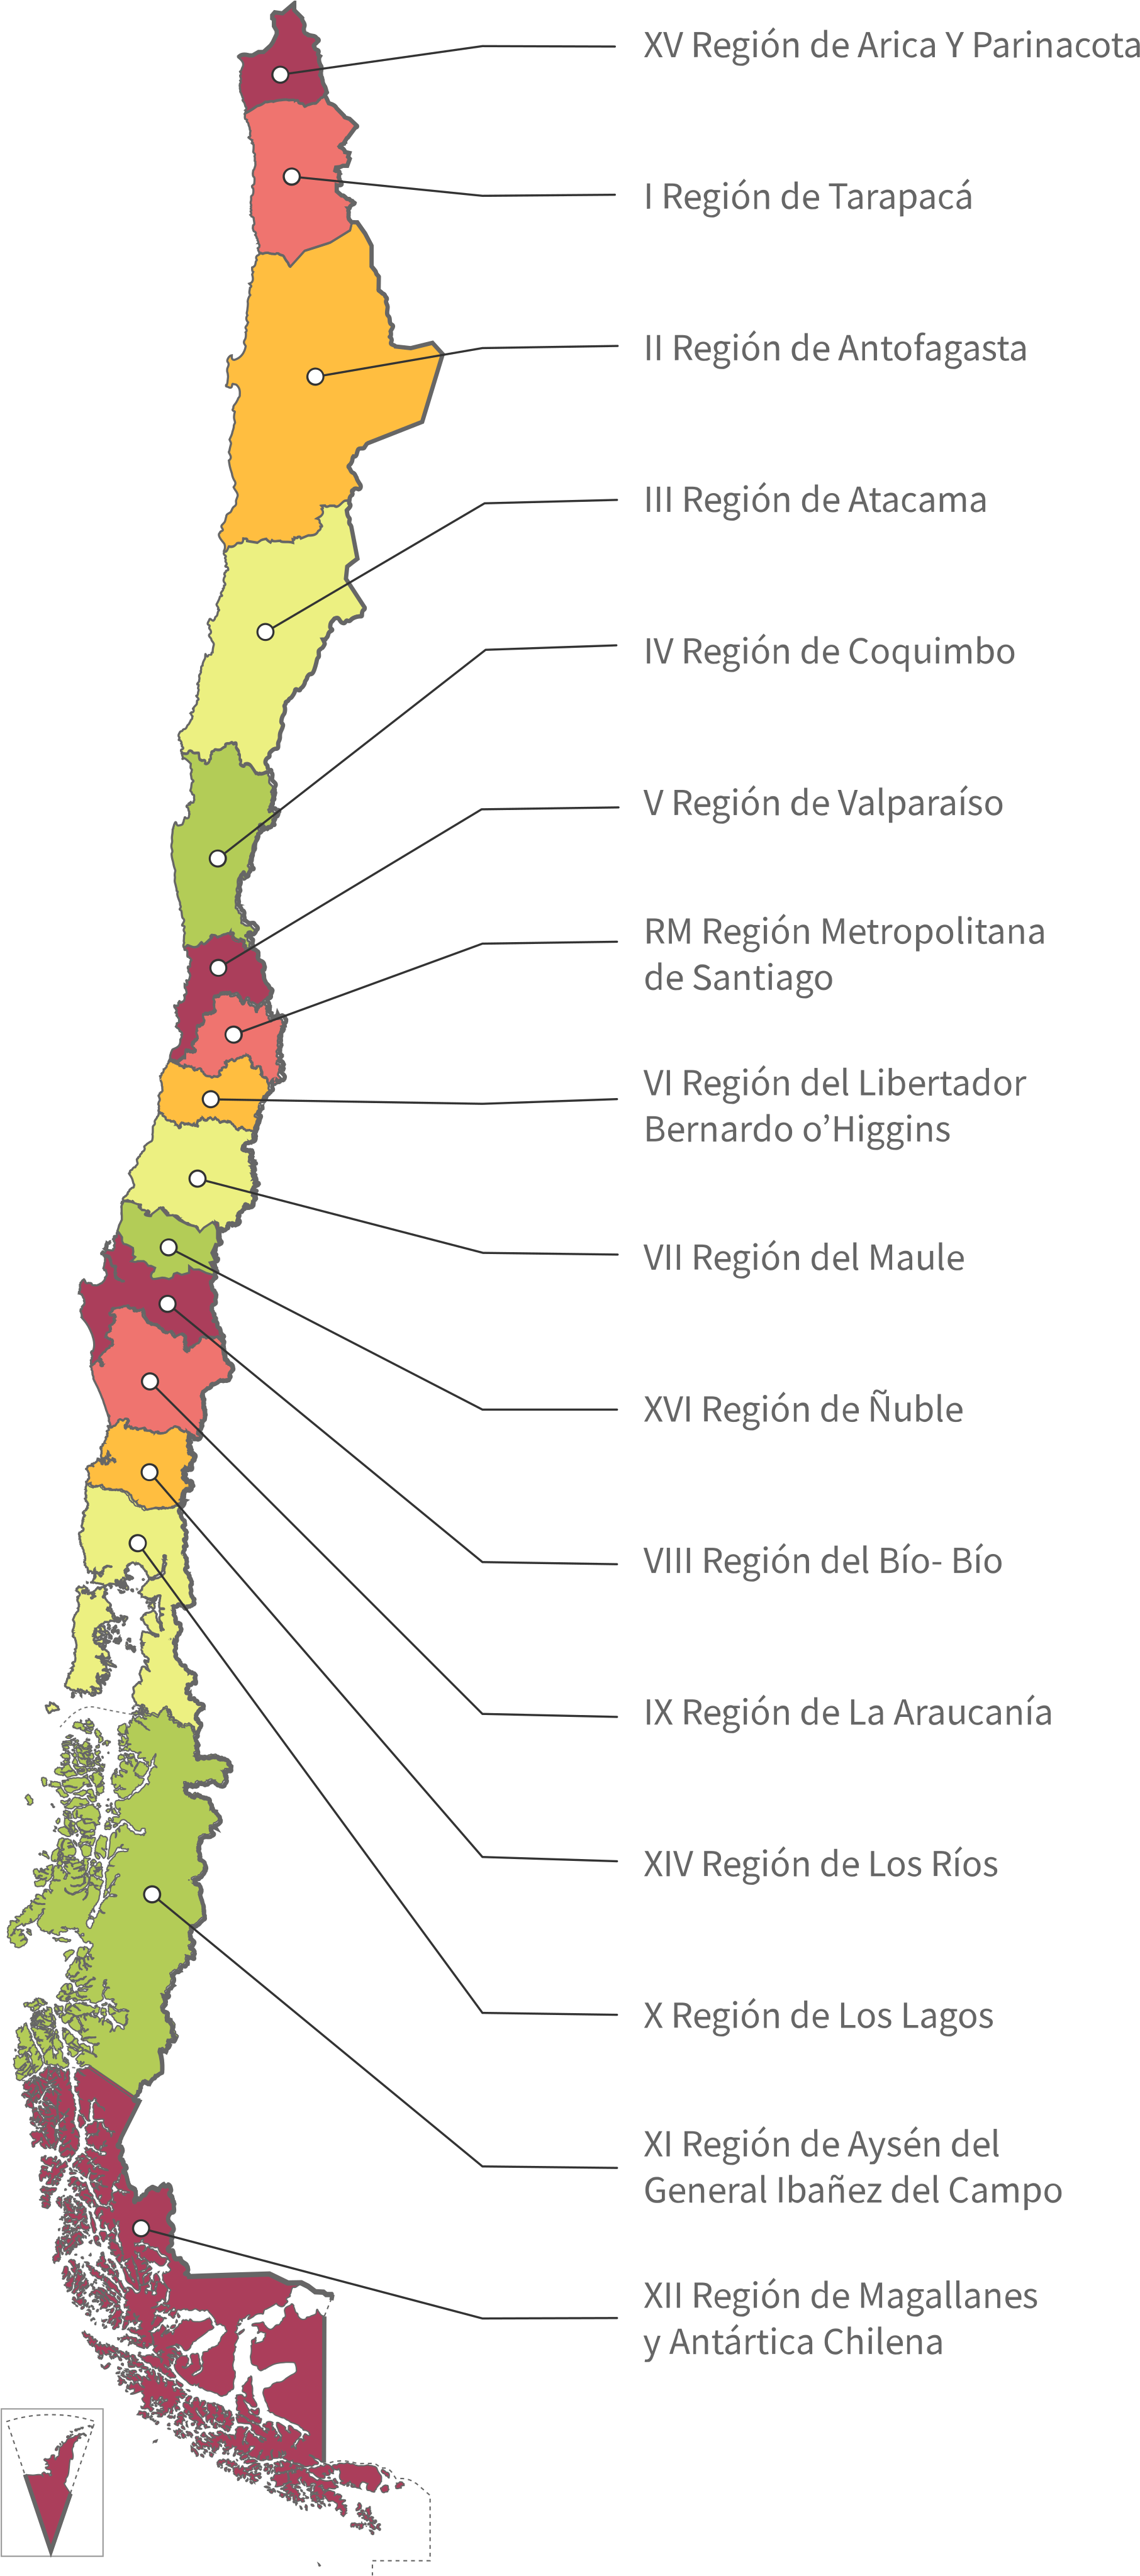
The plot shows the huge concentration of the "population" in the 13th Region. If you take into account the 5th Region is neighbor of the 13th (see the ma below), we can easily conclude that most of the population of Chile lives in the central part of the country.
I found the following map to visualize the relation between the Region number and its location (Note that the 13rd region is the Metropolitan Region, aka RM)