Monte-Carlo calculation of pi
![]()
The Monte-Carlo integration technique is uses random numbers to generate a sample of points, which would be tested toward a condition defining whether the point counts for the integration (remember that integration is just a generalization of the sum).
The simplest application I can think of is to calculate a n approximate value of the number \(\pi\).
Note that the area of a unit circle is \(A = \pi R^2 = \pi\).
For the sake of simplicity, I would generate a two-dimensional numpy array of random numbers (in the range \([0,1]\)), that will denote the \((x, y)\)-coordinates of a Cartesian plane. Since all the numbers are positive, I'd be seeing solely the first quadrant, and I'd have to remember that the final result would be four times the numerical result. Now, with the data at hand, we have to count the points that satisfy the condition \(x^2 + y^2 < 1\), and normalize by the number of samples.
Here is the code:
import numpy as np

samples = 1_000_000
data = np.random.rand(samples, 2)
result = data[:,0]**2 + data[:,1]**2
print(f"Exact: {np.pi}")
print(f"Approximate: {4 * np.sum(result < 1) / samples}")
Exact: 3.141592653589793
Approximate: 3.142332
You can find more about the Monte-Carlo integration in Wikipedia. There is an example of the calculation of the area of a circle.
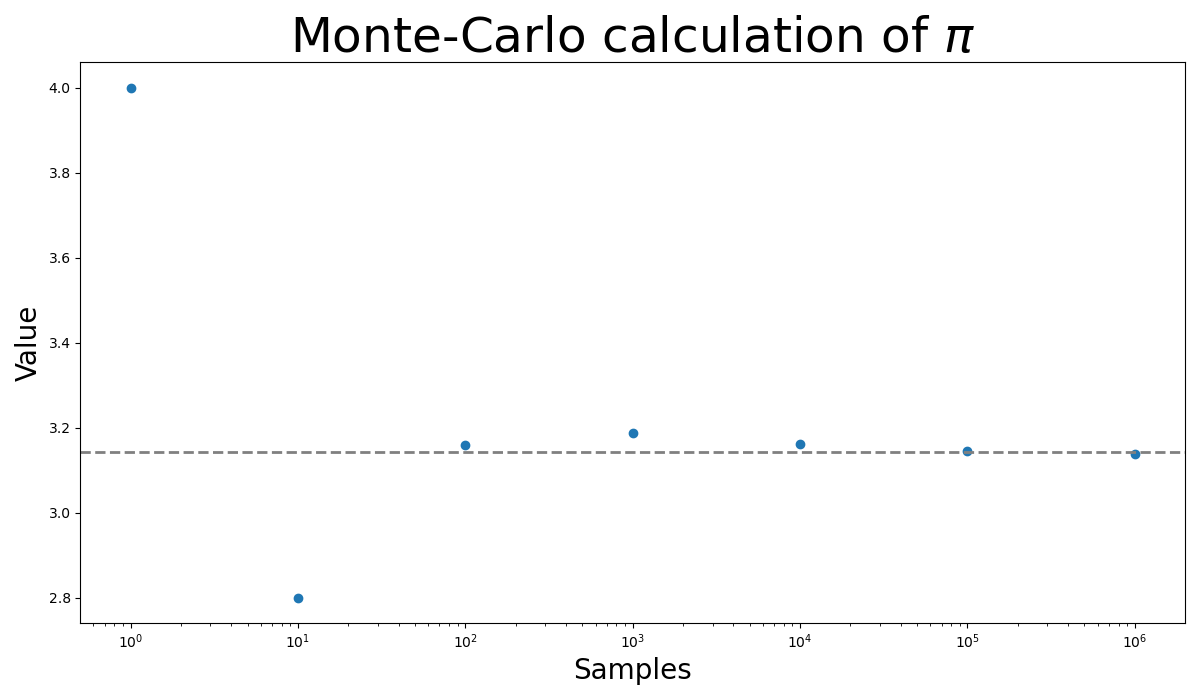
Update 1
My dear friend Gastón Moreno, modified my code to track how the Monte-Carlo result approach to the exact value. Inspired in his modification:
import numpy as np
import matplotlib.pyplot as plt

samples = 10**(np.arange(7))


def calculate_pi(samples):
    data = np.random.rand(samples, 2)
    result = data[:,0]**2 + data[:,1]**2
    return 4 * np.sum(result < 1) / samples


approx = np.array([calculate_pi(sample) for sample in samples])

plt.figure(figsize=(12,7))
plt.scatter(samples, approx)
plt.axhline(np.pi, lw=2, linestyle="dashed", color="grey")
plt.title(r"Monte-Carlo calculation of $\pi$", fontsize=35)
plt.xlabel("Samples", fontsize=20)
plt.ylabel("Value", fontsize=20)
plt.xscale("log")
plt.tight_layout()
plt.savefig(filename)
return filename