Moving car: constant vs increasing velocity
My son has regained interest by science, thanks to "Miwu Science" and "Mark Rober".
Hence, I used this momentum to introduce him to the physical concept of movement.
Imagine a car traveling at \(50\) Km/h.
- How far would it be after \(1\) hour?
- How far would it be after \(2\) hour? … I continue asking up to \(4\) hours.
He answered perfectly! But, I wanted to know if he was understanding the operative behind the answers.
- What do you do to know the result?
- I add \(50\) Kilometers to the previous result — He answered.
- If the car travels at \(100\) Km/h, How far would it be after \(1\) hour? … — I started asking him again, the whole set of previous questions.
We built up some tables
| Velocity: | 50 Km/h | ||||
|---|---|---|---|---|---|
| Time: | 0 h | 1 h | 2 h | 3 h | 4 h |
| Distance: | 0 Km | 50 Km | 100 Km | 150 Km | 200 Km |
| Velocity: | 100 Km/h | ||||
|---|---|---|---|---|---|
| Time: | 0 h | 1 h | 2 h | 3 h | 4 h |
| Distance: | 0 Km | 100 Km | 200 Km | 300 Km | 400 Km |
As you might know, He has been learning the meaning (and operative) of multiplication. So, I drove the conversation that way:
- Did you notice that the distance can be calculated using multiplication?
- 🤯
- How would you calculate the distance?
- \(D = v \times t\).
- GREAT!!!
The next step was to show him a plot! (I added intermediate point, to visualize the shape of the curve)
import numpy as np
import matplotlib.pyplot as plt

t = np.linspace(0, 4, 9)


def distance(velocity):
    return velocity * t


plt.figure(figsize=(12,7))
plt.scatter(t, distance(50), label="50 Km/h")
plt.scatter(t, distance(100), label="100 Km/h")
plt.title("Ploting traveled distances", fontsize=30)
plt.xlabel("Time [h]", fontsize=20)
plt.ylabel("Distance [Km]", fontsize=20)
plt.legend()
plt.tight_layout()
plt.savefig(filename)
return filename
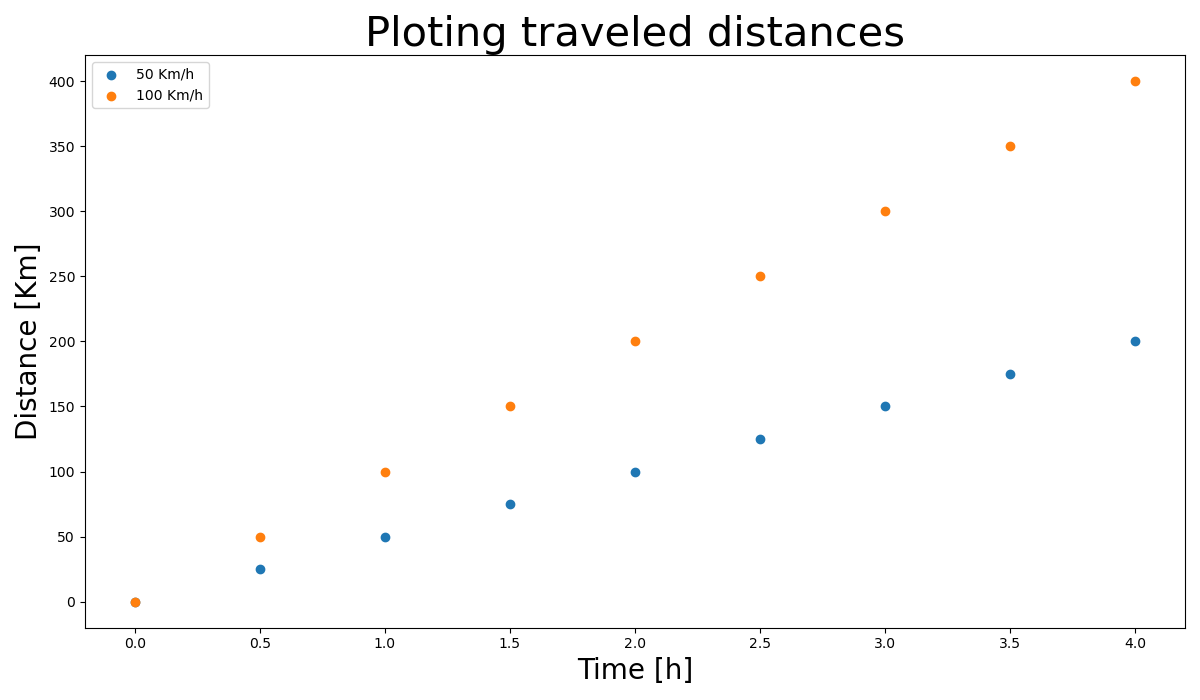
The plots are straight lines, this might not be a surprise for you… but it is for children).
- What would happen if a car travels first through a rural street at \(10\) Km/h, then on a better road at \(30\) Km/h, later at \(50\) Km/h and finally at \(70\) Km/h?
- The first hour the car travels \(10\) Km. Then, I have to add \(30\) Km for the second hour, \(50\) Km the next hour, and \(70\) Km the last hour!
| Velocity: | 10 Km/h | 30 Km/h | 50 Km/h | 70 Km/h | |
|---|---|---|---|---|---|
| Time: | 0 h | 1 h | 2 h | 3 h | 4 h |
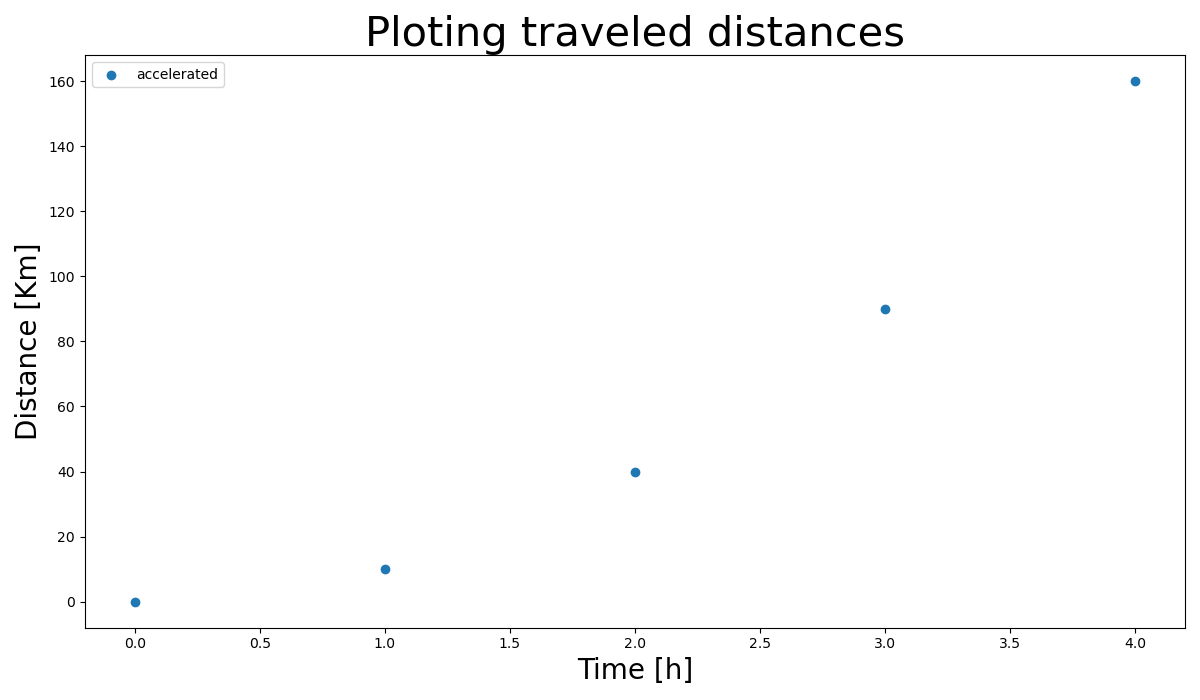
| Distance: | 0 Km | 10 Km | 40 Km | 90 Km | 160 Km |
How can we describe this movement?
For the sake of simplicity, let's consider the tens of the above quantities:
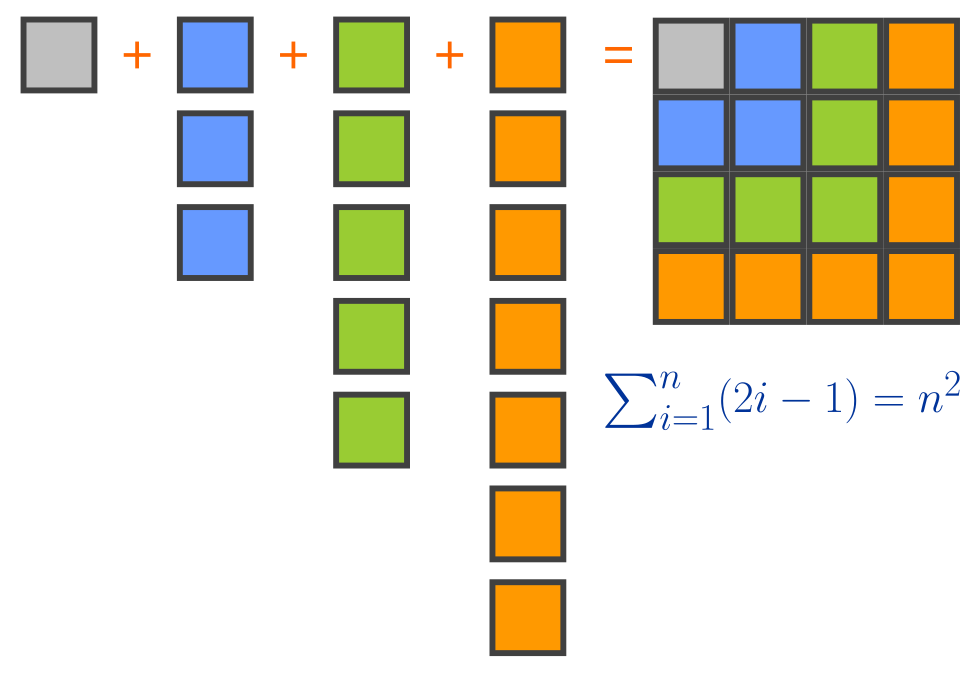
From the draw above, we can conclude that,
\begin{align*} 1 & = 1^2 \\ 1 + 3 & = 2^2 \\ 1 + 3 + 5 & = 3^2 \\ 1 + 3 + 5 + 7 & = 4^2 \end{align*}after a number of hours, the distance is ten times the square of the number of hours❗
import numpy as np
import matplotlib.pyplot as plt

t = np.linspace(0, 4, 5)


def distance(time):
    return 10 * time**2


plt.figure(figsize=(12,7))
plt.scatter(t, distance(t), label="accelerated")
plt.title("Ploting traveled distances", fontsize=30)
plt.xlabel("Time [h]", fontsize=20)
plt.ylabel("Distance [Km]", fontsize=20)
plt.legend()
plt.tight_layout()
plt.savefig(filename)
return filename