Plotting the tangent function with python
In a previous post I used the ndarray data type provided by numpy to plot some known functions, see the section U-functions of that post.
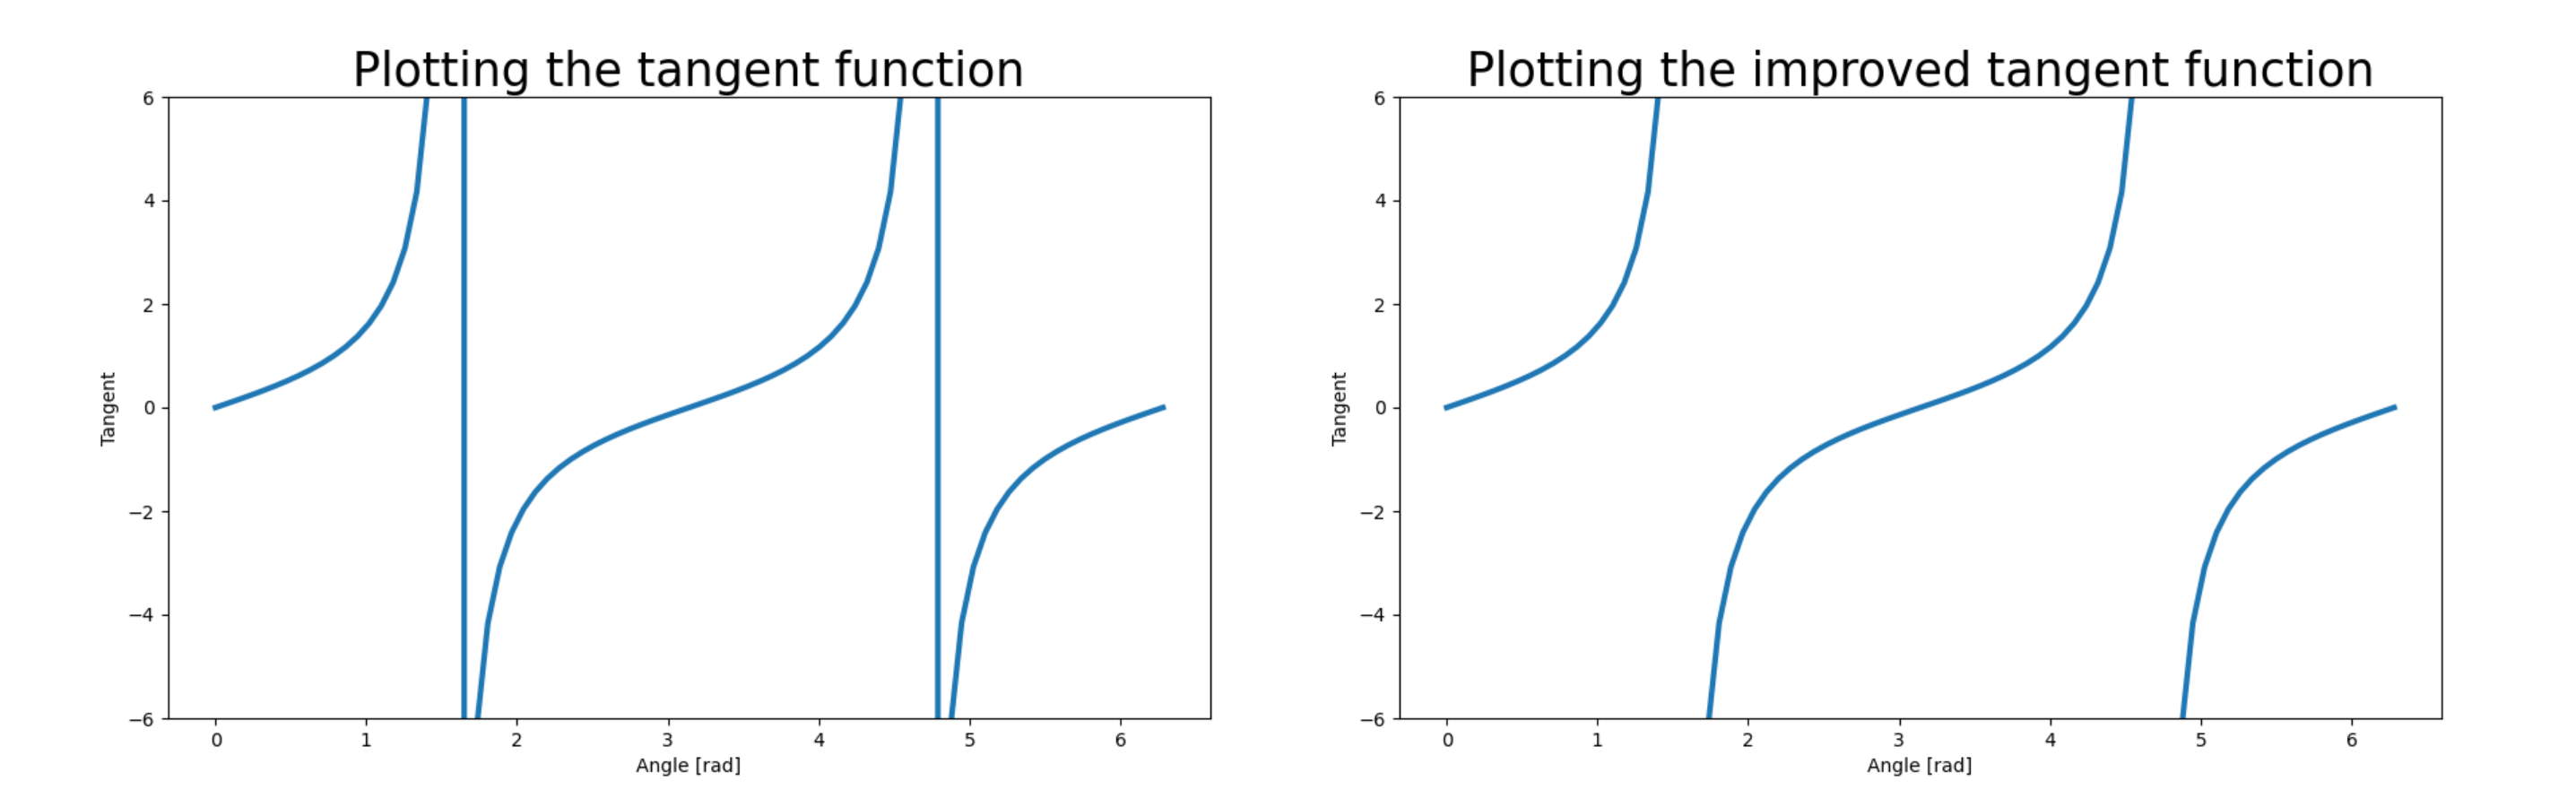
When creating the plot with various functions on it, I tried to plot the tangent function… but the result was not the one I expected.
import numpy as np
import matplotlib.pyplot as plt
angle = np.linspace(0, 2 * np.pi, 81)
measure = np.tan(angle)

plt.figure(figsize=(10,6))
plt.plot(angle, measure, lw=3)
plt.title("Plotting the tangent function", fontsize=25)
plt.xlabel("Angle [rad]")
plt.ylabel("Tangent")
plt.ylim([-6,6])
plt.savefig(filename)
return filename
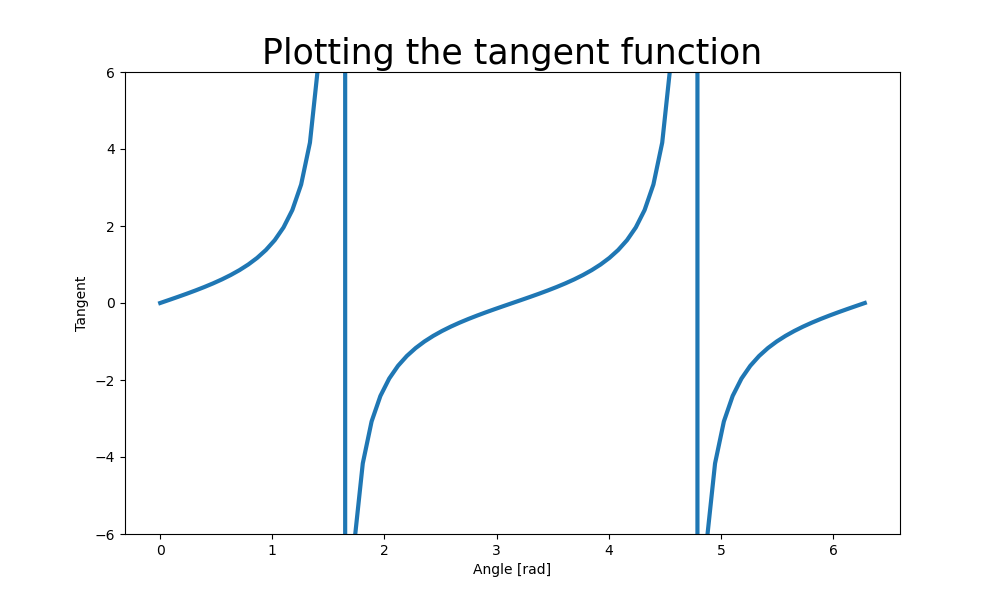
Why are there vertical lines? If you know your math, you expect the tangent function to be undetermined at odd multiples of \(\pi/2\), but this is not represented by a vertical line.
The vertical line is an attempt of the interpreter of connecting the values before and after the singular ones.
To avoid this behavior, the trick is to send the values above certain threshold to infinity (\(\infty\)).
The code looks like this:
import numpy as np
import matplotlib.pyplot as plt

angle = np.linspace(0, 2 * np.pi, 81)
measure = np.tan(angle)

threshold = 10000
measure[measure<-threshold] = np.inf
measure[measure>threshold] = np.inf

plt.figure(figsize=(10,6))
plt.plot(angle, measure, lw=3)
plt.title("Plotting the improved tangent function", fontsize=25)
plt.xlabel("Angle [rad]")
plt.ylabel("Tangent")
plt.ylim([-6,6])
plt.savefig(filename)
return filename
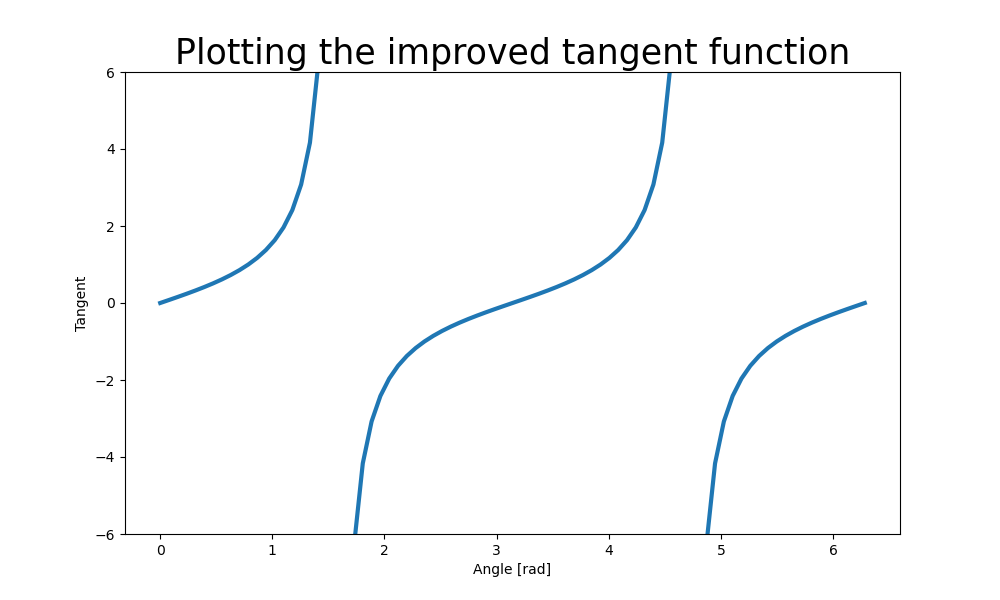
The strategy used to send the set of values to infinity is called masking. It is really useful, and we shall learn more about it in future posts.